Sensitivity analysis of HYMOD with FAST
SPOTPY gives you the opportunity to start a sensitivity analysis of your model. In this case, we included a global sensitivity analysis called "FAST" based on Saltelli et al. (1999).
The algorithm will tell you, how sensitive your parameters are based on whatever is given back by your objective function. Before you start to sample, you should know how how many iterations you need to get an reliable information about your parameter. The number of iteration can be calculate after [Henkel et al. GLOBAL SENSITIVITY ANALYSIS OF NONLINEAR MATHEMATICAL MODELS - AN IMPLEMENTATION OF TWO COMPLEMENTING VARIANCE-BASED ALGORITHMS, 2012] (https://www.informs-sim.org/wsc12papers/includes/files/con308.pdf):
$$N = (1+4M^2(1+(k-2)d))k$$
with N = needed parameter iterations, M= inference factor (SPOTPY default M=4) and d= frequency step (SPOTPY default d=2) and k as the number of parameters of your model.
In our case, we provide the hymod model as an example You can start the simulation with
So the first step is as always to initialize the spotpy setup class example: import spotpy from spotpy.examples.spot_setup_hymod_python import spot_setup spot_setup=spot_setup()
As a next step we apply the above formular to determine the number of repetitions needed for the FAST analysis. In our case we have k=5 parameter in the hymod model, so we need N=2245 repetitions to get reliable results:
rep = 2245
And that's already it. Now we can start the sensitivity analysis: sampler = spotpy.algorithms.fast(spot_setup, dbname='FAST_hymod', dbformat='csv') sampler.sample(rep)
This will take some time. Meanwhile SPOTPY will report you about the progress and the approximate duration. Further SPOTPY will create a database for you with the name 'Fast_hymod.csv', depending on the users selection above. This file will contain the return objectivefunction values, the sampled parameter sets, the simulation results and some information about a chain (not relevant for FAST).
These results can be loaded, e.g. directly from the sampler:
results = sampler.getdata()
OR, by loading the results from the database:
results = spotpy.analyser.load_csv_results('FAST_hymod')
Finally SPOTPY gives you some tools at hand, to analyse these results. E.g. if you want to determine, which are the three most important parameter of your model, you can use the following:
spotpy.analyser.plot_fast_sensitivity(results, number_of_sensitiv_pars=3)
This will show you a Plot with the total Sensitivity index of all your parameters and in this case the five most sensitive parameters (can be adjusted). Herein we use a already create spotpy setup class from the tutorial. The code for this class is available
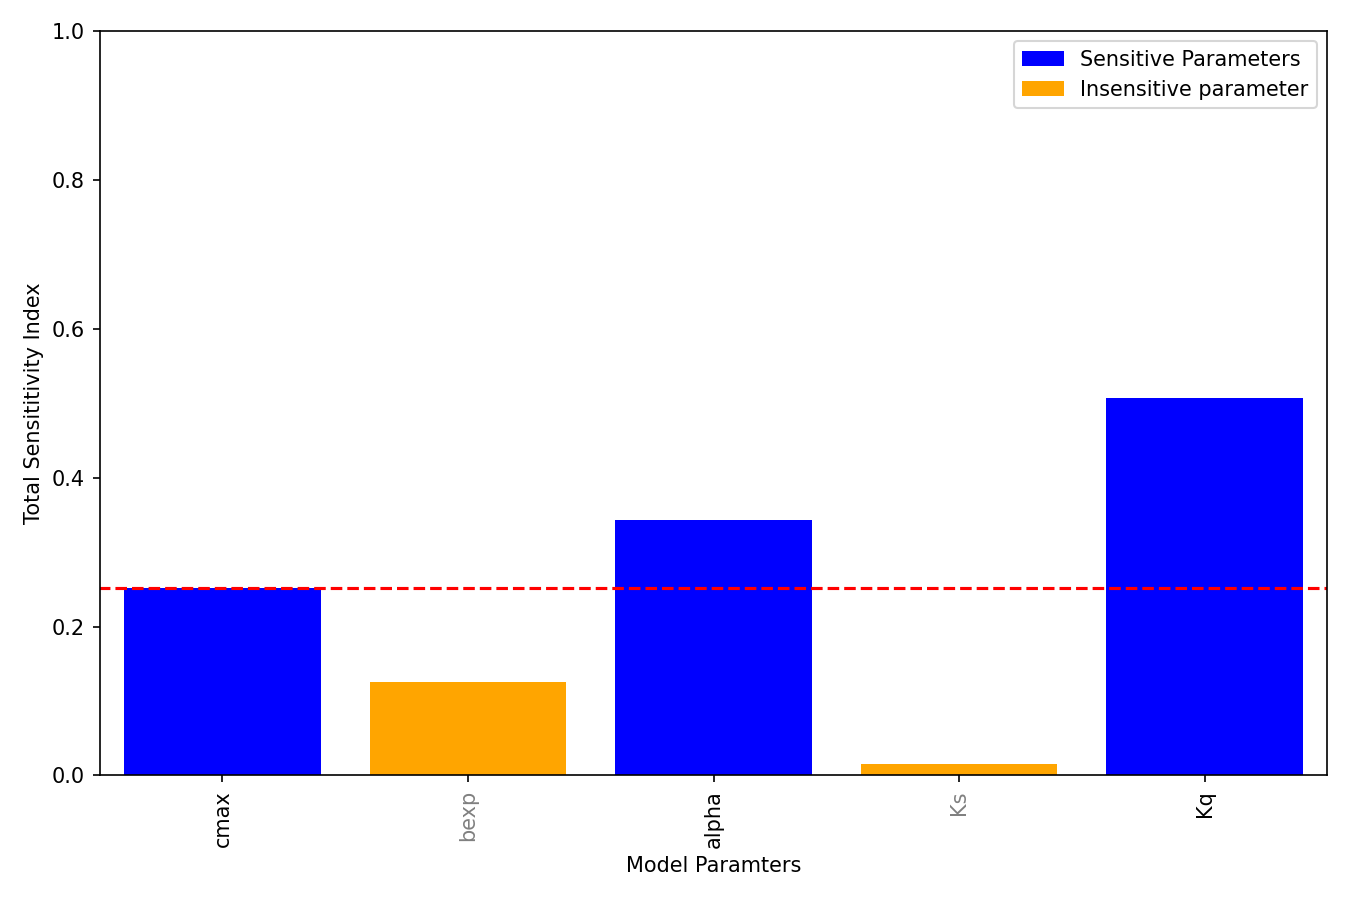
Figure 1: Example output of a sensitivity analysis using the FAST (Fourier Amplitude Sensitivity Test). Total sensitivity index is plotted for every model parameter. Sensitive parameters are plotted in blue, insensitive parameter in orange.
The corresponding code is available for download here.